It is well known that the Covid pandemic, and the government's response which resulted in the also well known disastrous aftermath, altered consumer spending patterns. There was a sharp drop in consumer spending between January and April 2020, with overall spending falling from an annual rate of $14.1 trillion in January to $11.8 trillion three months later. That is, consumption dropped 16.9% in that short period.
This is a sharp contrast to historical spending which averages an annual increase of 3.1%. Of course, there are several recessionary periods when spending also fell, but never as much. The worst case was in the middle of the 1930s Great Depression, when consumer spending fell 9% in 1932, still much less than the mentioned 16.9% drop during the pandemic.

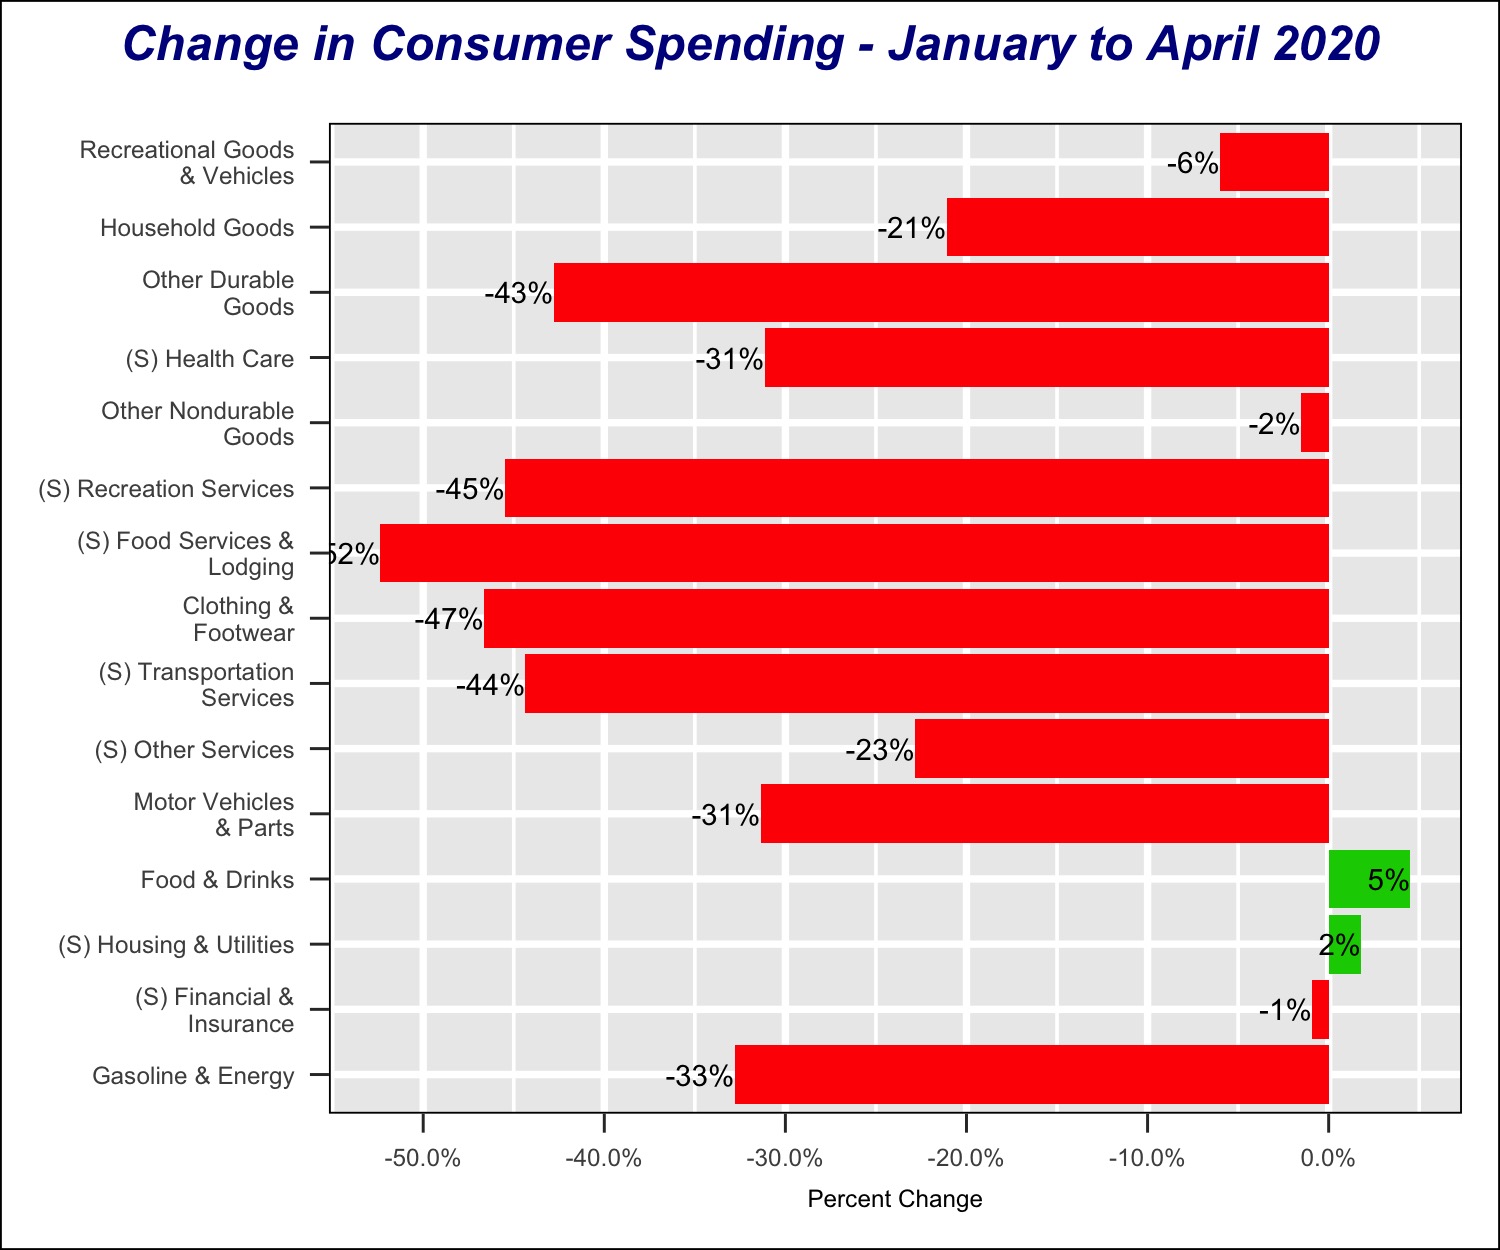
Other "service" categories with substantial drops in spending are Recreation Services, down 45%, and Transportation Services falling by 44% in that short period. Both of them imply continuous contact with other people, that the government attempted to reduce by setting mandatory distances to be maintained by business establishments. Who does not remember the "six-foot rule" established by many organizations, with markings on the floor indicating where one needed to stand n line? At the end, the basis for this rule proved to be arbitrary and totally ineffective.
Scanning down the chart we can see that the likelihood of human contact is reduced the further down the category is. At the bottom there are two categories, the green bars, where spending actually increased. Housing & Utilities rose 2% over this period. Spending here is either necessary or fixed, such as utilities, or rental costs which we know rose during this period.
The largest gain is labeled Food and Drink, which rose 5% over those four months. This category refers to food and beverages that are purchased to be consumed off-premises. That is, the likelihood of contact with others is minimized.
Are Consumer Spending Changes Permanent?
A natural question is whether some of these changes are temporary or do they reflect permanent changes in consumer spending. Of course the question can only be answered after some time has elapsed, for now we can only speculate.
The chart below shows annual changes in consumer spending over several periods, with green bars denoting "Goods" and light blue represent "Services." Note that the scales used are different in all four charts, thus a visual comparison is deceiving. We must look at the percentage in each of the bars. Also, all the percentages are stated as average annual rates, even in the chart displaying change between January and April 2020, the third chart from the left..

The two left-most charts show that growth in spending for Goods accelerated since the pandemic, while for most Services is either comparable to pre-pandemic changes, or slightly higher. Comparing the pre-pandemic to the after period, that is from January 2007 to January 2020 and from January 2020 to December 2023, we can see that the growth rate for many goods is faster in the second period.
Spending for Recreational Goods & Vehicles had increased 12% annually between 2007 and 2020, but jumped to 17% since 2020. Spending for Household Goods, e.g. furniture or appliances, rose from 4% to 5%, and spending for the Other Durable Goods category jumped to 8% since the pandemic, from 4% annual growth previously. This category includes items such as personal jewelry, luggage, etc.
The fifth bar, which shows spending for Other Nondurable Goods, increased from 2% annually pre-pandemic, to 6% since January 2020. Here are included items such as paper plates and cups, disposable diapers, etc.
Further down, we can see Clothing & Footwear changes in spending that also rose from 2% to 6%, and Motor Vehicles & Parts increasing from 2% to 4%. In contrast, the annual pace of spending all types of services has slowed down. Health Care has dropped from 3% to 2%, Recreation Services moved from 2% to 1%, and Transportation Services as well as Other Services have also dropped from 2% in the thirteen years before the pandemic, to 1% since then.
Long Term Consumers are Spending More on Services

Spending for services had actually reached an all-time high in 2019, when it accounted for 68.6% of all consumer spending, two percentage points more than last year. The Covid pandemic drove spending for many types of services down although there is a modest recovery underway.


...and Spending Less on Goods
The converse of consumers spending more on Services is that they spend less on Goods naturally. Thus their spending for all types of goods fell from 56.6% back in 1929, to 33.5% last year. That is a loss of 23.2% over this long period.
The long-term drop in the goods share, which fell from 56.6% in 1929 to 33.5% last year, is driven by nondurables share losses. They fell from 43.9% in 1929 to 21.5% last year. Durables barely moved less than a percent from 12.7% to 11.9%.

The vast majority of the drop in spending for goods is centered consumer purchases of two major categories of nondurable goods, shown in the right panel above. One is spending for Food & Beverages consumers purchase for consumptions "off premises." The share of spending for this category has fallen by 13.% since 1929. It represented 21% of consumer spending in that year but fell to 7.8% last year.
The second category is spending for Clothing & Footwear which had a 11.7% share of spending in 1929, only to drop to just 2.8% last year. This is an 8.9% decline over those 97 years.
The spending data comprehends roughly 100 different categories. The share of spending of he vast majority of them, 78 goods or services groups, changed less than 2% over 1929 to 2023 period. But two important areas where consumer spending pattern has changed little over the last 97 years are Motor Vehicles and for Housing.
Share of Spending on Motor Vehicles
The automobile industry has seen dramatic changes over the last century. Cars have more features, are more efficient, households have more than one vehicle, etc. But despite all these changes consumers are allocating virtually the same proportion of their spending on vehicles today as they did back in 1929.
Back then, as can be seen in the chart below, consumers spent 5.3% of their 1929 budget on motor vehicles (including spending for the vehicle itself, plus service parts and maintenance). Fast forward 97 years and we find that spending increased just 0.7% to 6.0% last year. The more things change the more things stay the same.

Note, in the chart above, the relative stability of spending share in the second half of last century, from 1950 to 2000. That is the period marked by the horizontal red line in the chart. In this period share of spending averaged 7.8%, almost two percent higher than today. But it moved within a narrow range from a low of 6.7% to a high of 8.8%.
Spending on this group, that is Vehicles, Parts & Maintenance, falls in almost every recession. But the largest declines are during the Second World War, the are highlighted in light red, and between 2000 and the Great Recession of 2008-2009.
But the 0.7% increase in overall spending for vehicles since 1929 is the result of an 0.8% increase in Vehicle Services, including maintenance, repair and other services. Its share was 1.0% in 1929 but rose to 1.8% last year.
Parts and Accessories share of spending has remained virtually unchanged over time, falling by only 0.1%. But more interesting is the fact that spending for both New & Used Motor Vehicles was the same in 2023 as it was back in 1929- 3.5% share. This is the result of consumers increasing their purchases of used vehicles by 1.3%, while dropping their share of new vehicles by an identical 1.3%.
Consumer Spending for Housing