- Total construction is up modestly 0.4% in September but a more robust 8.7% from last year.
- The bulk of the gain from last year originates in the nonresidential sector, which is up 19% while residential construction fell by 2.1% since September of last year.
- The principal growth drivers overall are Manufacturing buildings, up 62%, Education buildings, up 19%, Power buildings, up 16%, and Health Facilities, up 15%.
- Construction of manufacturing buildings rose $76 billion over the last year, accounting for nearly half (48%) of the increase in total construction.
The U.S. construction market remains relatively strong overall, although signs of weakness are beginning to show up. Spending for all types of projects, public and private, rose 0.4% in September reaching just under two trillion dollars ($1.997 trillion annual rate). September marks the ninth consecutive month when spending for construction projects increased- bringing spending to a level 8.7% higher than the same month a year ago. In real terms, that is adjusting for inflation, spending is 5.5% above last year.
Spending across the two major major segments, i.e. public and private construction, rose in September (see left panel of chart below). Total private construction is 0.4% higher than the previous month reaching $1,556 billion (that is $1.6 trillion) in September. Private construction accounts for 78% of the U.S. market and is 6.9% higher than last year.
Public construction also rose in September, coincidentally by a similar 0.4% but to a smaller $441 billion. It is 8.7% higher than the same month last year and currently accounts for slightly over one-fifth of the market (22%.) September also marks all-time spending highs for both private and public construction.
Private construction has grown by nearly four times over the last thirty years. The data in the charts, which begin in January 1993, indicates cumulative growth of 352%; that is from $344 billion back in early 1993 to the 1,556 billion this year.
Public spending for construction projects has also increased but at a smaller magnitude, rising by 287% over the same period. That is current spending of $441 billion is nearly three times the $113 billion in early 1993.
An alternative segmentation of the data is the most common division between Residential and Nonresidential projects, shown in the right panel in the chart above. Both follow similar patterns although nonresidential lags residential by more than two years, reflecting the fact that it takes longer to initiate and complete nonresidential projects.
Earlier this century, around the 2008-09 recession, residential peaked in January 2006 with $681 billion spent, while nonresidential peaked more than two years later in October 2008 reaching $719 billion. Both of them bottomed around 2012 and have risen sharply since then.
The Fed's policies maintained over the last ten years or so had driven mortgage rates to levels below 5%- we had not seen rates below 5% since at least the early 1970s. Such low rates encouraged construction of both residential and nonresidential projects. Although the recent increases have not impacted nonresidential construction yet, their impact on residential is already evident as the chart above shows.
Residential Construction
- The residential market remains relatively strong, driven primarily by construction of multifamily housing units.
- Although it is expected that multifamily construction will ease in the near future as the record number of multifamily units currently under construction are completed. There are currently over a million units under construction, equivalent to roughly two years' demand.
- Single family housing continues to fall.
The bulk of residential construction today emanates from the private sector. Residential buildings publicly funded are just around one percent of the total, except for a short period around the 2008-09 recession when public residential construction rose to about 5% of the total. Currently, public spending for residential construction lingers around ten billion dollars, a small figure in relation to the $882 billion overall residential market.
Thus here we concentrate on the private sector, which represents the bulk of the residential sector.
Residential construction data from the Department of Commerce estimates is available for three different segments: new single family housing, new multifamily housing and expenditures by homeowners for remodeling. Combined these three segments are generating $872 billion annually, but adding the pubic sector the total rises to $882 billion.
The increase in construction over the last few months originates from greater activity in both single and multifamily housing. Although new single family housing had been falling since early last year, it reversed course in May of this year but it barely reaches a similar level it had in November last year. That is, single family construction is running at slightly over four hundred billion ($402 billion annual rate, shown in the chart below). Single family rose 1.3% in September but it remains 5.9% below a year ago.
Multifamily construction, on the other hand, paints a more rosy picture. Construction of multifamily housing units has been increasing for at least a year now. However, the construction pace has been slowing down gradually, in September construction actually fell, albeit by a negligible one-tenth of one percent (0.1%). Spending on multifamily houses reached $136 billion in September, the highest amount ever recorded for this sector.
We'd anticipate further declines in multifamily construction. The increases in mortgage rates, which have reached nearly eight percent recently and are one percent and a half higher than the beginning of the year, are forcing builders and developers to slow down construction. Further, the huge number of multifamily units currently under construction, which currently exceeds one million units, is putting pressure on builders when these units are completed and put on the market.
Homeowner remodeling spending has also fallen recently- it fell in seven of the last twelve months. Spending in September was $334 billion, 5.4% lower than a year ago. Higher mortgage rates have made remodeling projects more expensive naturally.
Nonresidential Construction Sector
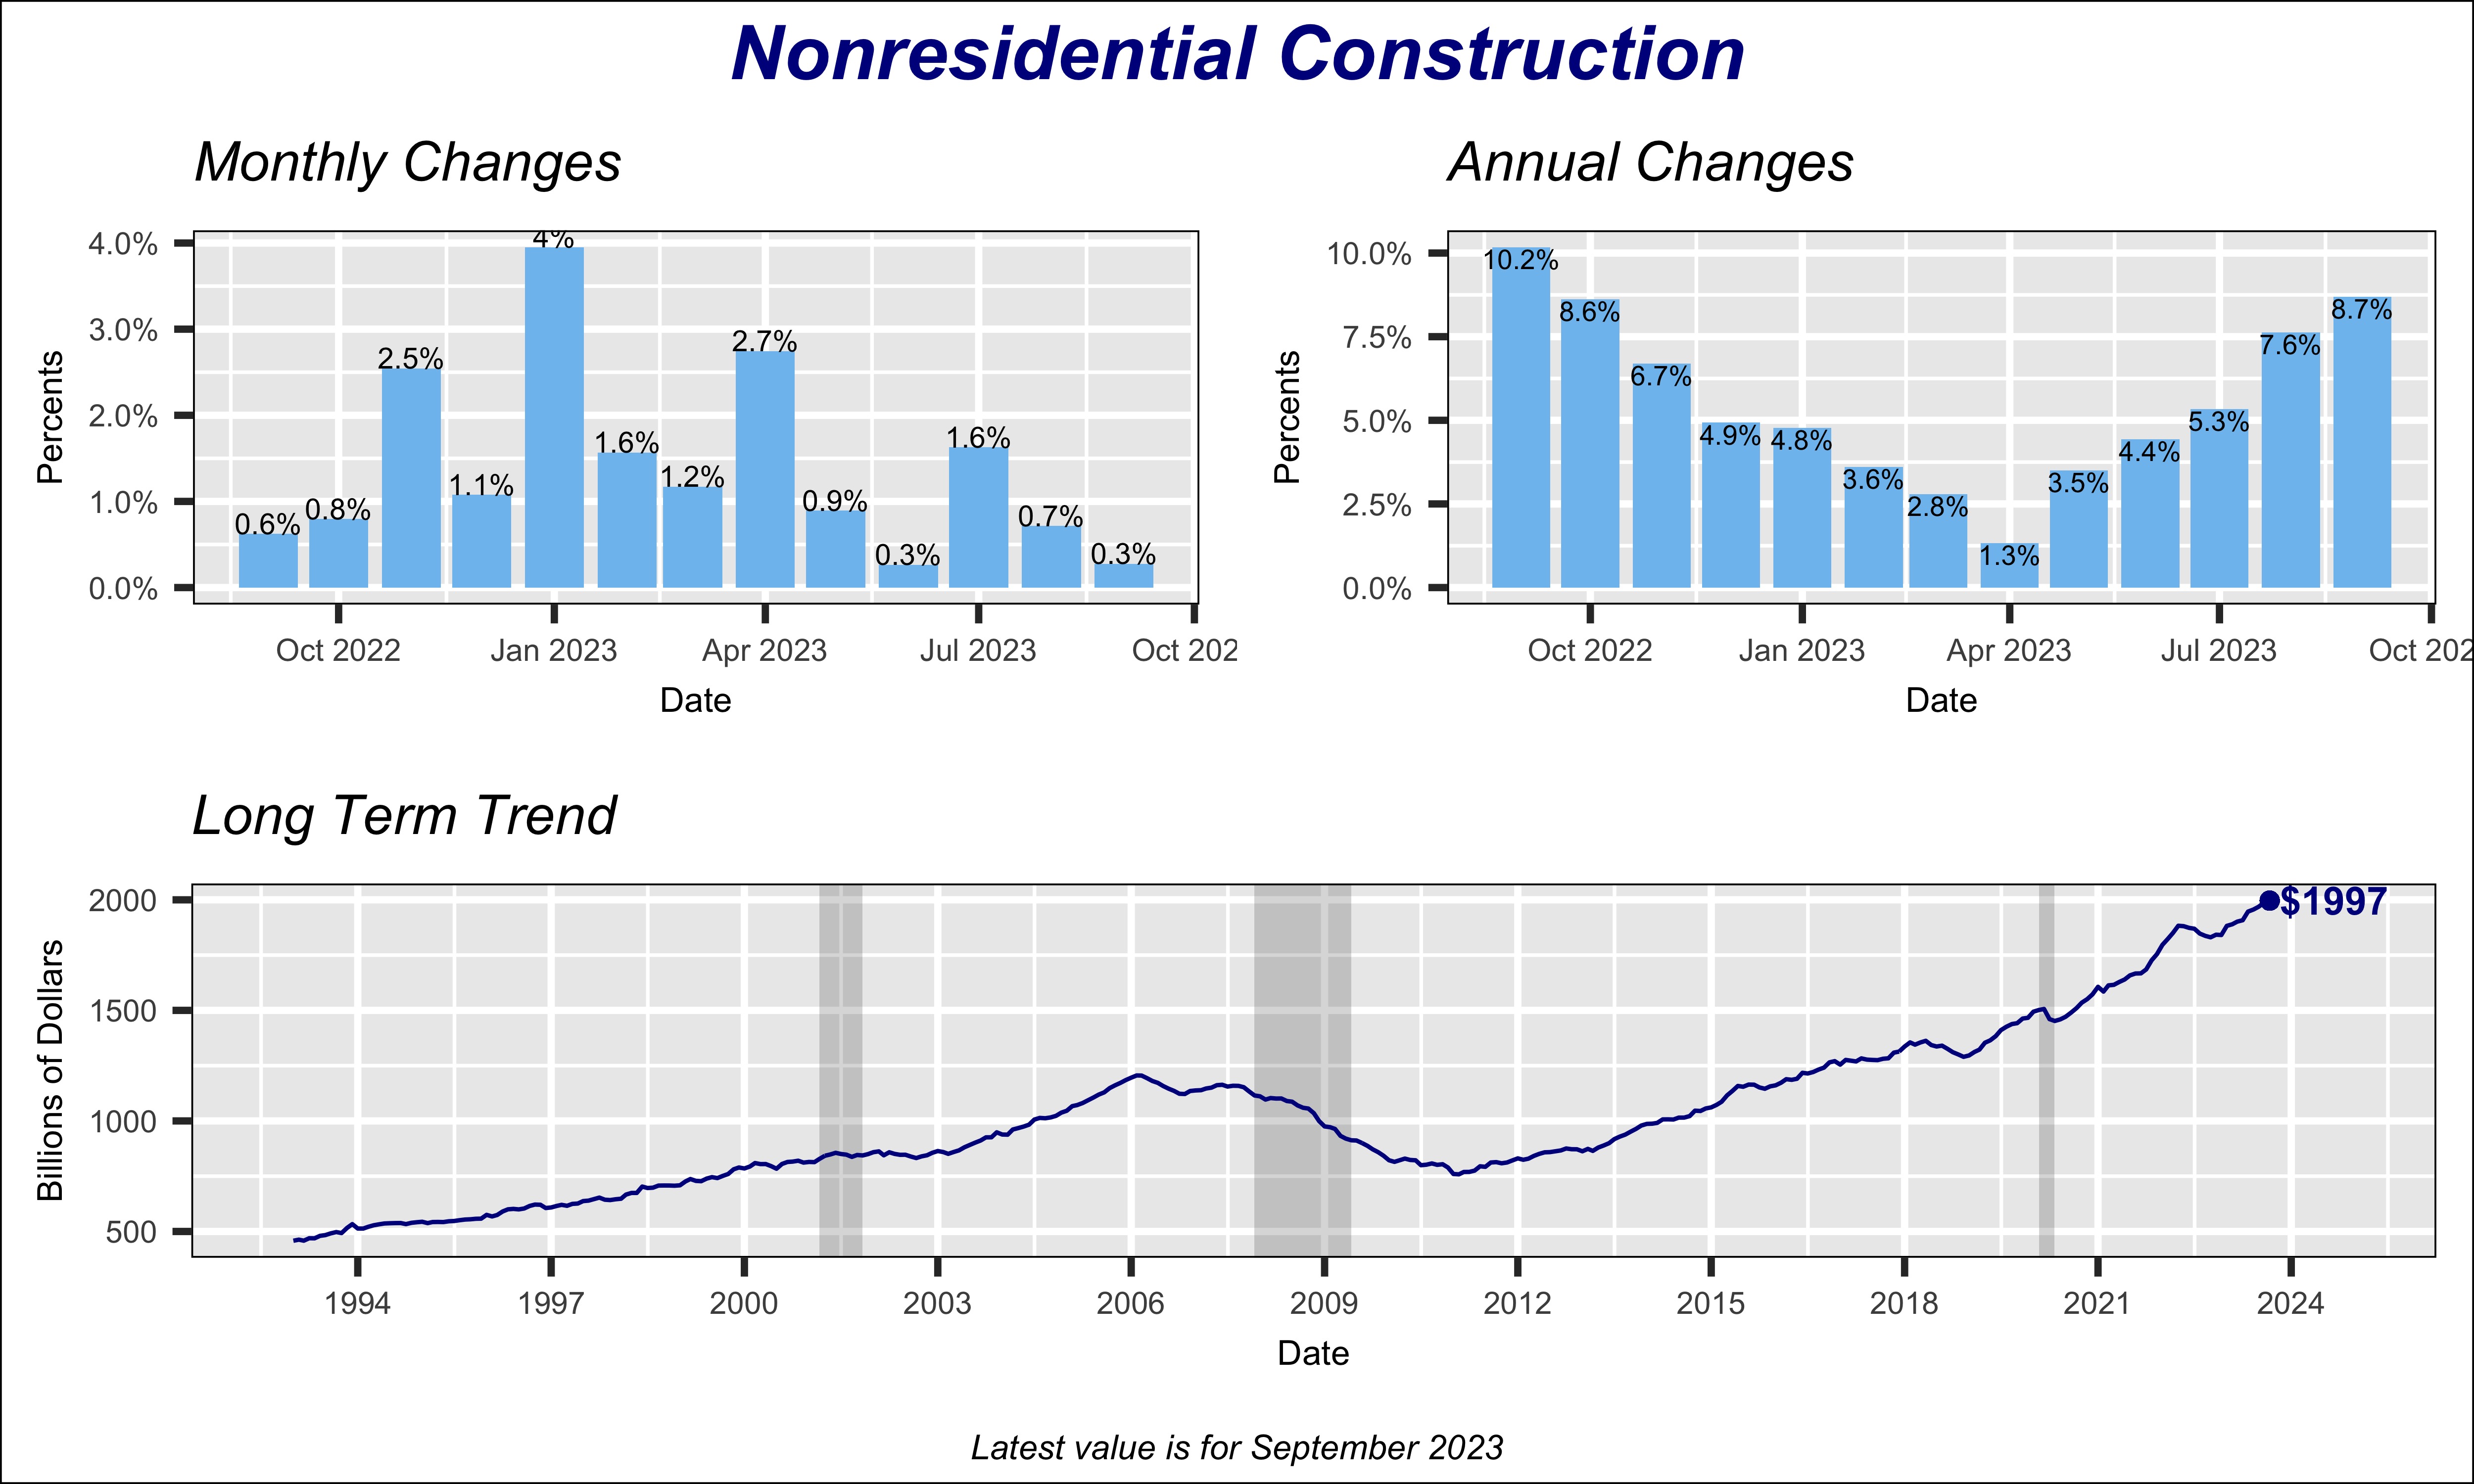
Overall nonresidential construction has been rising more or less steadily since 2011, to reach $1.11 trillion in September of this year (at annual rate.) Spending dropped modestly by 5.4%, in the aftermath of the Covid pandemic, between January 2020 and June 2021. But it recovered strongly since then by rising 33% in the last year and a half. The growth pace has been slowing the last few months, however, as can be seen in the "Monthly Changes" graph in the chart below. Compared to September of last year, nonresidential construction is 8.7% higher.

Currently, the biggest contributor to nonresidential construction is manufacturing, shown by the red line in the chart below, which shows major nonresidential construction types as percent of the nonresidential total. Historically, construction of manufacturing buildings represented under 10% of total nonresidential market, except for a few years around 2015 when it briefly exceeded 10%. But the emphasis by Federal government policies to support a shift towards electric automobiles has boosted manufacturing construction to nearly 18% of the nonresidential sector.
Data Source: U.S. Department of Commerce