The trend of building smaller houses continued further last year. The median size of a new single house started in 2023 was 2,179 sq. ft., down 90 sq. ft. from the prior year. Recall that the median is the figure indicating that half of the homes are smaller, and conversely. The average, i.e. mean, house size also fell to 2,411 sq. ft., that is 74 sq. ft. , or 3.0%, smaller than the year before.
The chart above shows that single family houses have become smaller since 2015, when the largest new houses were built. The median size of a new single family house in 2015 was 2,466 square feet, shown by the blue line in the chart above. That is, houses today are 287 sq. ft smaller, reflecting almost the loss of a full room.
On an average size basis, the biggest new houses were also built in 2015 when the mean size of a single family house reached 2,689 sq. ft. This is 278 sq. ft. more than those built last year.
The steady shrinkage of house sizes can be appreciated better in the chart to the right. It displays the quarterly changes in house size for the last five years. Note that we are using quarterly data here, rather than the annual data shown in the chart above.
The bars represent the change in house sizes from one quarter to the next. For instance, the average house size fell 60 sq. ft. in the fourth quarter of last year to 2,374 sq. ft.
Also, although we are not showing it here, the number of houses built each quarter changes. There were 259 houses started in Q3 down to 238 thousand in Q4.
Size of Multifamily Housing Units
A similar pattern is observed in the multifamily sector. That is, new housing units were biggest earlier this century and their size has been almost in a free fall. The only difference is that while both the median and average size of single family houses fell last year, for multi family units we find the average falling to 1,050 sq. ft. in 2023, but the median rose to 1,020 sq. ft. Last year was the only time since 1999, when these data first became available, when the average and median sizes moved in different direction.
The chart to the right displays the historical annual trend in the size of multifamily housing units. Biggest units were built in 2006, with the median at 1,192 square feet. The average multi unit size was almost 100 sq. ft. larger than the median that year, measuring 1,291 sq. ft.
One reason for the significantly larger multifamily units built in 2006, when the median size rose from around 1,100 sq. ft. to nearly 1,200 that year, is that a larger number of those units were built for condominium purposes, rather than for apartment rentals. Condominium units, which are homes owned by the persons living in them, tend to be larger and with more amenities than rental units.
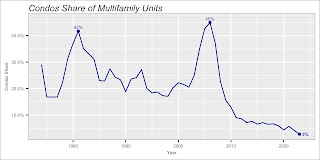
In 2006 nearly half of the multifamily units, 45% actually, were built for condominium purposes. Prior to that year fewer than a quarter of the units were condominium with the significant exception in the early 80s. In 1981 condominiums accounted for 42% of all multifamily units built that year.
Last year, as can be seen in the chart nearby, condos had fallen to just 3% of the multifamily units, the lowest historical level. Incidentally, a few of the single family homes are also built/sold as condominiums. In 2022 they were less than 3% of all single family houses.
Regional Patterns
Similar to the national trend in the size of single family houses, all four regions also had reductions in house size. The declines ranged from a small drop of 2.2% in the South region, to a relatively large one in the Northeast were the average single family house was 8.4% smaller.
The average size of new houses in the Northeast region, which always leads the nation with the largest homes, fell to 2,572 sq. ft. This is down from over 2,800 sq. ft. in 2022 and, as can be seen in the chart below, this region's single family homes have also exceeded 2,800 sq. ft. in two previous years- 2014 and 2015.
Builders in the Midwest region produce the smallest houses in the nation. In contrast to the Northeast, new single family houses in this region are always smaller than any other region's. Since 1999, when house data at the region level first became available, Midwest new houses have been 150 sq. ft. smaller than the national average. Last year they were 159 sq. ft. smaller.
The size of new houses in the South and West is closer to the national averages. The South region's are on average 34 sq. ft. larger than the nation's, although last year were 43 sq. ft. bigger.
The West region's houses have been smaller than the national average since 2009. But overall this region's houses have been 24 sq. ft. smaller. Last year the gap was 72 sq. ft.
Regional Multifamily New Housing
On the multifamily housing side we find that one of the regions, the Midwest, bucked the national decrease in the average size of multi housing units. That is, the average size of multifamily units in the region rose last year to 1,050 sq. ft., just barely higher than in 2022.
New multifamily housing units in the West region were 1.2% smaller last year, with a reduction of just 12 sq. ft. in one year.
Implications of the trend towards smaller houses


