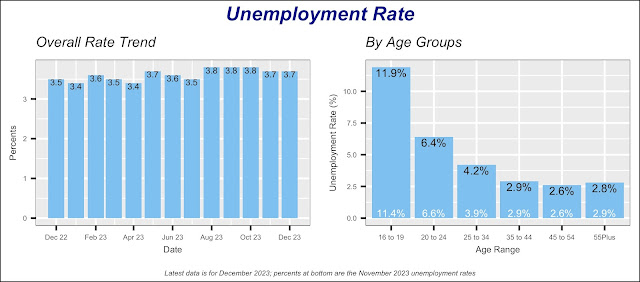
The U.S. unemployment rate has deteriorated slightly over the last year. While the rate was 3.5% at the end of 2022, by the end of last year it had worsened to 3.7%. Not a big change but an adverse change nonetheless. In fact, the rate has been at or above 3.7% in each of the latest five months.
On a generational basis, the unemployment rate has worsened for people in two age groups. For the youngest workers, those between 16 and 19 years of age, the rate rose by half a point from 11.4% in December of 2022 to 11.9% at the end of last year. The other group posting higher rate at the end of 2023, is the 25 to 34 year olds, which went from 3.9% to 4.2%. This can be seen in the chart below.
Another perspective is a comparison of the unemployment rate geographically. As one would expect, there are differences in unemployment across the various regions in the U.S. Naturally, we find that some states have a rate higher than the national average of 3.7% and, conversely, the rate for other states is better (i.e. lower) than the total U.S.
States in the map below in red shades are those whose current unemployment rate is higher than the national average and, conversely, those states with rates below the national average are shown by green shades.
We can readily see that states in a swath from Washington to Texas all have a rate higher than the national average; except for Oregon which posted a December rate of 3.7%. There are also some states towards the East-Central part of the nation, from Illinois to New York with (relatively) high unemployment rates.
Nevada currently posts the highest rate in the nation with a December 2023 rate of 5.4% unemployment. It also has exceeded the U.S. rate every month since 2007. The average unemployment rate in Nevada, from 2005 to December last year, has been 1.8% higher than the overall U.S. rate.
California, Illinois, and New Jersey are other states with currently highest rates. California is also one of a handful of states whose unemployment rate has been above the national average for all of the available data history. The other states with unemployment rates mostly above the national average are Illinois, Michigan and Kentucky.
At the same time, there are several states which have consistently maintained unemployment rate below the national average. Among this group we find Maryland with 1.9% unemployment rate in December. This state's average rate is 0.81% below the nation's rate. Montana's rate is 1.4% below the U.S. rate, Utah is 1.9% below, and Iowa is 1.8% lower than the U.S. Both Dakotas are also better than the nation, with South Dakota's average 2.6% below the U.S., and North Dakota even better with 2.9% gap from the national rate.
Other states performing better than the overall U.S. are Idaho with an average unemployment rate 1.1% below the U.S. , Virginia is 1.4%, Kansas is 1.3% lower and Vermont is 1.9% below.
While the total U.S. unemployment rate has deteriorated over the last year, as we mentioned above, many states bucked this trend.
The map below displays the change in unemployment rate between December 2022 and December of last year. States whose unemployment rate has deteriorated more than the nation, that is the rate has increased more than the U.S. change of 0.2%, are shown in shades of red.
A few states stand out with an oversize increase. New Jersey's unemployment is 1.5% higher than a year ago. Similarly, California is one percent higher and Alaska is 0.8% higher. Montana, Colorado and Missouri post rate 0.6% higher than in December 2022.
States with improving unemployment rate are Oregon, 1.1% lower today, Maryland also 1.1% although impossible to see in the map. Other states are Wyoming (0.9% lower), Hawaii (0.8%), and Pennsylvania and Vermont both also 0.8% lower.
An exploration of the relationship between industry concentration and states' unemployment rate was unsuccessful. Deeper analysis is required for an explanation of the variation of unemployment among states.


